Guest blogger Ken Spriggs talks about how he made sense of his medical data by creating a graphic electronic health record, the DIYEHR.
[Update 11/25: the data visualization that Ken created is so extraordinary that we’re adding it here, four days after the original post. LOOK how he helped his physicians “get” his medical history! What an empowered, thoughtful, creative, participatory patient. – e-Patient Dave]
Dave deBronkart’s TED talk inspired me. I went on a “damn data” collection mission by ordering data from all the places where my Crohn’s disease had caught up to me. I ordered medical records, medical bills, insurance information, and pharmacy data. It’s a collection worth about 13 years, 600 pages, and came from nearly 20 sources. Impressive, no? But it’s not having the data that’s important, it’s what you do with it that matters.
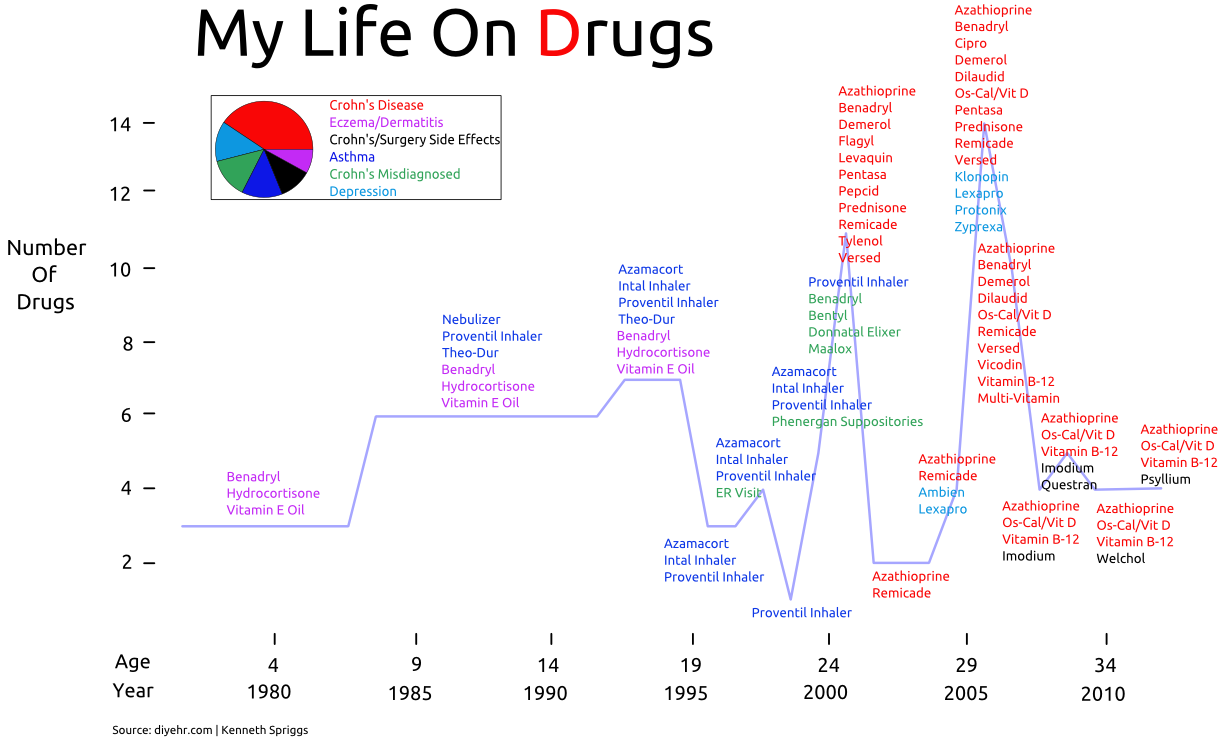
My ambition was to condense that epic volume into something useful. I love infographics. They’re quick and clear, they’re memorable and they tell a story. Another great attribute of having something visual is that you can see your data under a new light. It becomes a narrative you can step back from. Having a different perspective can lend itself to insights. The first infographic I created is called “My Life On Drugs.” Take a look: http://bit.ly/szDvUs (and above). It’s a summary of all the drugs I had to take each year. I counted everything even if it was given to me once. It makes a story.
There’s dramatically more information there than meets the eye. Patterns emerge. I’ll give a few examples.
You can see I have a history of inflammatory diseases — first was eczema, then asthma, and now Crohn’s disease. When my asthma was developing my skin was clearing up and when my Crohn’s was developing my asthma was clearing up. You can clearly see this transition just by reading from left to right. Perhaps they’re related?
There’s another useful discovery — it’s the inclusion of the Vitamin B-12 injections. As soon as B-12 was prescribed I no longer needed depression medication. I didn’t even have depression, I had a vitamin deficiency. How often does this mistake happen? It’s a horrid oversight and I’m sure I’m not the only victim.
The last observation I’ll make is that the combination of Remicade and azathioprine lost its efficacy and it landed me in more trouble than just before I was diagnosed — which I assure you was an awful lot of trouble. And then there’s a big drop in the number of drugs I’ve had to take post surgery. In retrospect I’d have chosen to avoid the drugs and opt for surgery back in 2001. It’s not the conventional medical practice but it’s useful to see a case study where drugs are not an optimal solution.
Along the way of creating this first infographic I’ve had to learn a lot about data requests, organization, and trying to make my health records digital. It’s been tedious, fun, and frustrating but I now have my own Electronic Health Record!
In addition to the infographic I’ve also put together a how-to manual of what I’ve done so far. My quest isn’t complete but I feel like I’ve got enough to share. If you like, visit diyehr.com to see if there’s anything you might benefit from.


Love this!
Thanks. I’ve done a bit more along these lines but just focused on a decade of Crohn’s. I’ll try and get it finished up within 2 weeks.
Fantastic! your setting a terrific example for other patients. I just wrote a quick linked piece on my IBD blog:
http://lilcrohnsie.blogspot.com/2011/11/example-importance-of-being-pro-active.html
I can’t believe I’ve never been to this page before, I’ll certainly be coming back!
Ugh, *you’re* setting a terrific example :)